The Friday Alaska Landmine column: Alaska’s fiscal system is #1 … in terms of regressivity
Alaska's fiscal system is the nation's most regressive; that puts a heavy burden on Alaska families in the middle & lower-income brackets, and the numbers are showing an ongoing decline in those here
Periodically, the Institute on Taxation and Economic Policy (ITEP) publishes an update to its “Who Pays?” reports. The most recent – the 7th edition – was published earlier this month.
As explained by ITEP:
Who Pays? is the only distributional analysis of tax systems in all 50 states and the District of Columbia. This comprehensive 7th edition of the report assesses the progressivity and regressivity of state tax systems by measuring effective state and local tax rates paid by all income groups. No two state tax systems are the same; this report provides detailed analyses of the features of every state tax code. It includes state-by-state profiles that provide baseline data to help lawmakers and the public understand how current tax policies affect taxpayers at all income levels.
After evaluating the distributional impact of the various components of each state’s tax system, the report then calculates an overall “ITEP Inequality Index” value for each state. In basic terms, the value reflects the differences in the effective tax rate for those in the upper-income brackets compared to those in the middle and lower-income brackets.
A negative “inequality index” value indicates that those in the middle and lower-income brackets are paying higher effective tax rates – paying more as a share of their income – than those in the upper-income brackets; in other words, the fiscal approach is regressive. The greater the negative value, the more regressive the fiscal approach.
The Who Pays? report then uses the “inequality index” from the various states to rank the states from the most regressive (those with the highest negative “inequality index” value) to the least regressive. The full ranking is in Appendix B of the report.
At first blush, Alaska is ranked 20th in regressivity – as the 20th most regressive state – with an “inequality index” of -4.4%. That alone is up from Alaska’s ranking as the 26th most regressive state in the report’s previous edition (October 2018), then with an “inequality index” of -3.3%.
But neither ranking includes any consideration of the hugely regressive impact of cuts in the Permanent Fund Dividend (PFD), which, while according to long-time University of Alaska-Anchorage Institute of Social and Economic Research (ISER) Professor Matthew Berman, are a tax (“Let’s be honest. A cut in the PFD is a tax — the most regressive tax ever proposed.”), is a unique source of funding not used in any other state.
Given the transparency of ITEP about the methodology used in its calculations, however, layering on the impact of PFD cuts is relatively easy, with somewhat startling results.
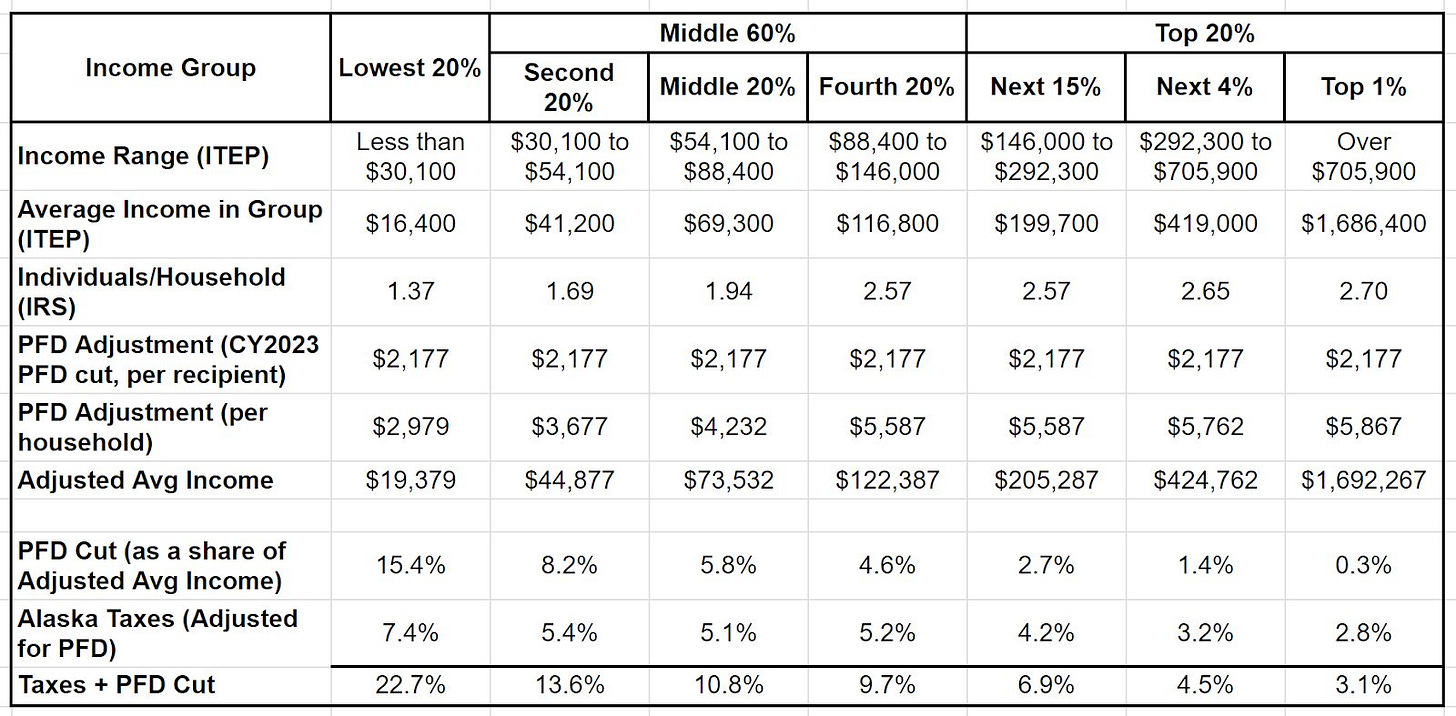
We layer on the impact of PFD cuts by adjusting the average Alaska income by income bracket used in the report to reflect a full (statutory) PFD for the same base year as used in the report (calendar year 2023), then include the PFD cut as part of the reduction to that income in calculating the effective tax rate. In calculating the full PFD by income bracket, we use the average household size for each bracket derived from the most recent Internal Revenue Service (IRS) data applicable to Alaska.
Here is the relevant data:
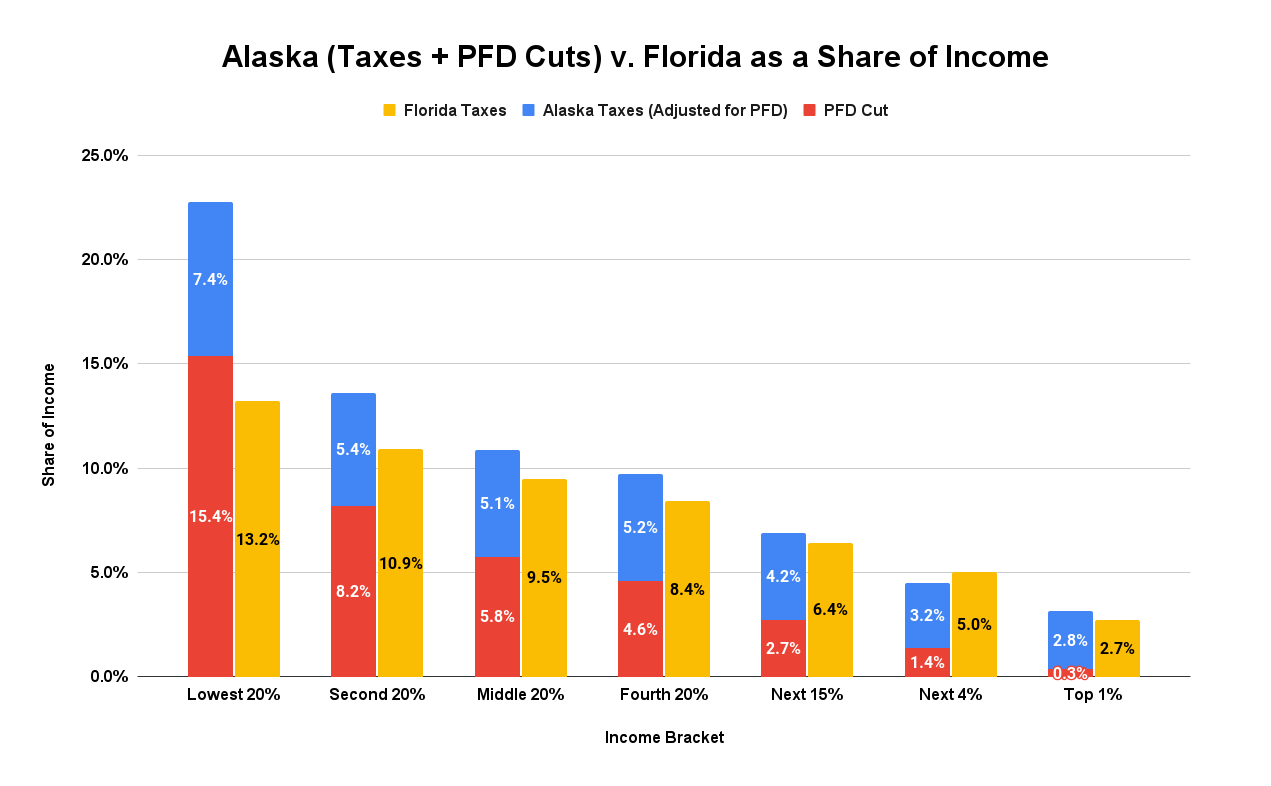
Using ITEP’s formula, we then calculate the “inequality index,” which results from including PFD cuts. The following chart summarizes the impacts compared to Florida, ranked No. 1 nationally in the report in terms of regressivity. As shown, Alaska leaps from No. 20 without including PFD cuts to No. 1, ahead of Florida, including PFD cuts.
The most startling part is that PFD cuts are so regressive that Alaska rises to the top of the inequality scale by including them alone before factoring in the impact of the other additional taxes assessed on a state and local basis. Running the calculations using PFD cuts alone results in an Alaska inequality index of -11.2%, well above that of otherwise No. 1 Florida (which has an inequality index value of -9.2%).
The following chart compares the two by income bracket. Even though Florida otherwise is the most regressive nationally, it looks relatively flat compared to the impact of Alaska’s PFD cuts.
Adding the other additional Alaska taxes assessed on a state and local basis to the impact of PFD cuts results in an overall Alaska inequality index value of -16.2%. Here is the impact by income bracket. The rates for the impact of “Alaska Taxes” are slightly lower for some brackets than the taxes-only calculation included in the report because of the impact of adjusting income to include the full PFD.
The combined Alaska inequality index of -16.2% is 75% higher than otherwise No. 1 Florida, with Alaska taking more as a share of income than Florida from every income bracket except for the “Next 4%.”
In short, using PFD cuts as a funding source ramps Alaska from what, viewed nationally, is already an upper-half regressive fiscal system to the most regressive fiscal system in the nation.
In a state that Governor Mike Dunleavy (R – Alaska) “wants to be the best place in the country to raise a family,” Alaska is using a fiscal system that is “by far the costliest” alternative for those very same families and significantly increases the poverty rate at a time when “about half of Alaska’s kids [already] are eligible for free or reduced-price lunches.”
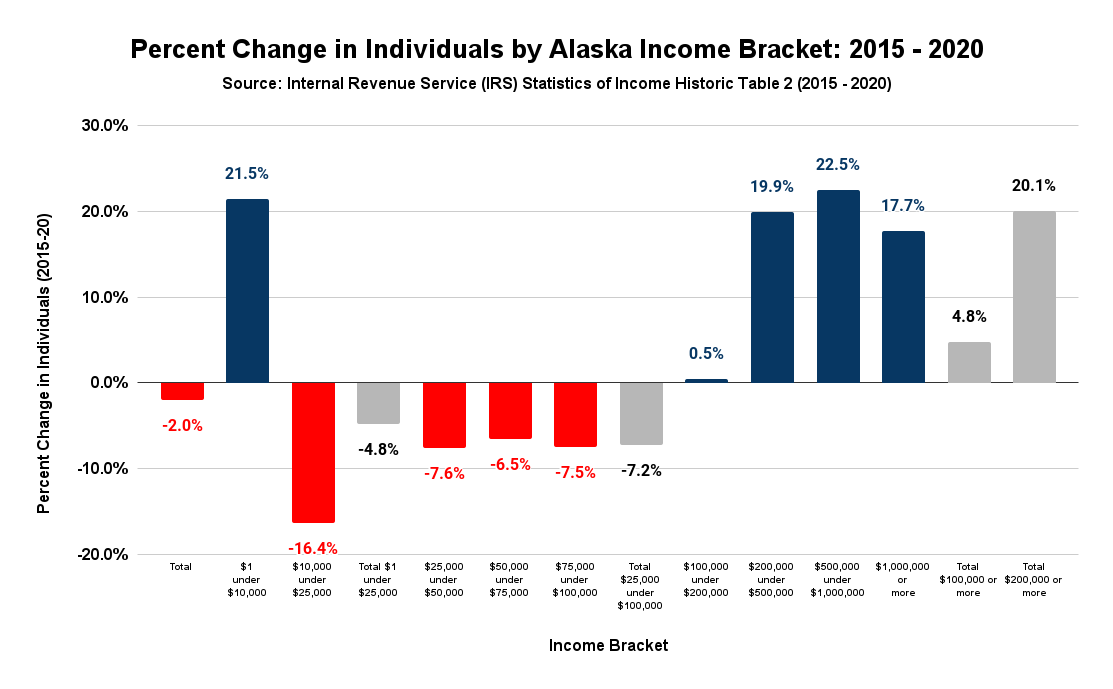
It should be no surprise that, according to IRS statistics, the number of lower and middle-income Alaskans is declining under that system at the same time as those in the upper-income brackets are growing.
According to those statistics, between the calendar years 2015 (the last year in which a full PFD was paid) and 2020 (the most recent for which data is available), the number of Alaskans declined overall by 2%, with the number of Alaskans in households with incomes under $25,000 falling by 4.8% and those in households with incomes between $25,000 and under $100,000 falling by 7.2%, but with those in households with incomes of $100,000 and above increasing by 4.8%, and those in households with incomes of $200,000 and above increasing, shockingly even more, by 20.1%.
For those interested, here’s the detail, broken down by year:
Yes, the number of Alaskans overall is declining, but the largely unreported news is that the decline is focused almost entirely within lower and middle-income – what most commonly refer to as working-class – households, those who are hit the hardest by Alaska’s hugely regressive fiscal system. Those in the upper-income brackets, who benefit greatly from the regressive system by downstreaming the tax burden to others, are actually growing.
In some respects, Alaska is beginning to look like a colonial system, with the number of those in the upper-income brackets, the overseers, growing, those in the middle and lower-income brackets who have the opportunity to do so increasingly departing (fleeing?), and with the balance made up of workers imported for a time for specific purposes.
Alaska’s hugely – indeed, “We’re No. 1” – regressive fiscal system is very near – if not at – the heart of that phenomenon.


