


The Friday Alaska Landmine column: How much spending and who’s paying for it?
What the various #akleg proposals this session add up to in terms of spending, what that means for future spending levels, and who's paying the tab; it's even rougher fiscal seas ahead than you think

One of the things that seem to be getting lost in the fog as this legislative session progresses is the overall spending level the Legislature is building toward. Yes, focusing on the individual categories of spending – such as K-12 – is important, but so is the resulting overall level. It’s the overall level that determines the deficit level and the extent of the need for supplemental revenues to cover it.
In developing the charts we have discussed in this column over the past couple of weeks we have used the spending levels reflected in the Legislative Finance Division’s (LegFin’s) “current policy” approach as a baseline. But as the session wears on and more and more spending proposals are put on the table, we have come increasingly to believe that baseline no longer captures the overall spending levels that potentially could result from this session and the resulting impact on where spending levels go from there.
Typically during a session, it’s difficult to develop projected spending levels on a real-time basis. There are a number of proposals and as various bills progress, updated fiscal notes are often lagging and confusing, and even when available, only provide a limited look at the out-year implications.
But this year, as various legislators have proposed or talked about potential Permanent Fund Dividend (PFD) levels, we have realized that there’s a second way to determine the projected spending levels they have in mind, by using the PFD levels they propose to calculate the amount of the statutory PFD they anticipate diverting to close the resulting deficits, and from that to calculate the resulting spending levels they have in mind.
Here’s an example. In a Senate Majority press availability earlier in the session, Senator Bert Stedman (R – Sitka), one of the Senate Finance co-chairs, talked about the potential of ending up this session with a “$1,300 PFD.” Starting from the statutory PFD level of $3.860 projected by the Permanent Fund Corporation and incorporated into the Dunleavy administration’s FY24 10-year plan, that implies a PFD cut of roughly $2,560/PFD or, multiplied by 626,000, the approximate number of recipients last year, $1.6 billion in total.
Adding the amount of the diverted PFD to our most recent projection of traditional FY24 UGF revenues, calculated using current oil futures prices, results in total UGF revenues available for spending of roughly $5.8 billion.

To put that and the other proposals in context, here’s how that spending level compares to the baseline of “no new revenues” and the various other proposals that are being discussed or are in the background this session.
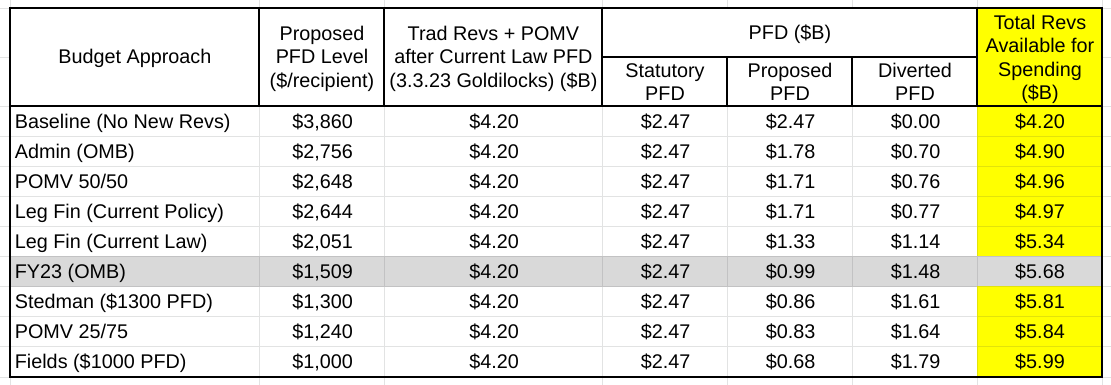
The spending levels being discussed range from the Dunleavy administration’s proposed FY24 UGF spending level of $4.9 billion, to Representative Zack Fields’ (D – Anchorage) “$1,000 PFD” proposal, which translates into an FY24 UGF spending level of nearly $6 billion.
As an additional reference point, we also have included in the chart the currently anticipated FY23 spending level (shaded gray line, taken from OMB’s most recent Fiscal Summary), which many at the time – just last year – said was not to be taken as indicative of future spending levels because of the inclusion of a number of one-time items justified by high oil prices.
Turns out, just one year later Senator Stedman’s “$1,300 PFD” proposal, POMV 25/75 and Representative Fields’ “$1,000 PFD” proposal all would result in spending levels above even that.
What impact do the various spending levels have going forward (or put another way, how long will the PFD last if the future baseline is reset at these spending levels)?
To estimate the first we have used the above spending levels to reset the FY24 baseline and then escalated those going forward based on the financial markets’ current projection of future inflation rates taken from our latest “Sunday Inflation Chart.” Because most, but not all UGF spending is affected by inflation, we have used .85 (85%) of the inflation rate as the annual growth factor.
Here’s the result:

Spending grows over the period from the relevant baseline at a compound annual rate of 2.18%. Starting from FY24 levels ranging from $4.90 billion (Dunleavy administration) to $5.99 billion (Fields’ “$1,000 PFD”), the FY32 levels range from $5.82 billion (Dunleavy administration) to $7.13 billion (Fields’ “$1,000 PFD”).
But that’s only the first question. The second – and much more important – is what those spending levels mean for deficits and the need for supplemental revenues.
The answer is much higher deficits (and, thus, the need for much more supplemental revenues) than some initially think. That’s because, as noted in the second column in the chart above (“Total UGF Revs (ex-Current Law PFD, 3.3.2023 AK4SB Goldilocks Chart”)), as spending levels are growing, due to declining oil prices traditional UGF revenues are actually falling from FY24 levels over the period.
The result? Deficits – the gap between declining revenues and growing spending – are growing at a significantly faster rate even than spending.
Here’s the result:

Or, if you prefer, in a graphic:
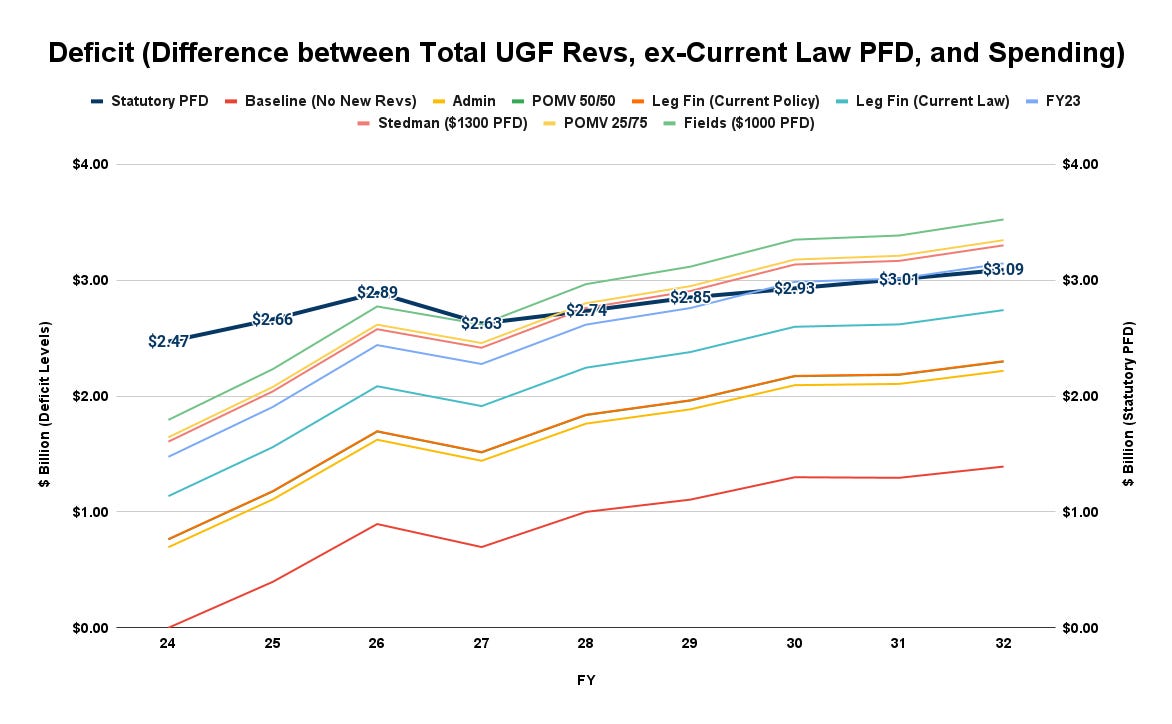
By FY28, five short years from now, all of the approaches – even the FY24 “Baseline” approach of “no new revenues” – are running deficits of greater than $1 billion annually. And several, beginning with LegFin’s proposed “current law” approach, already are running deficits by that point of greater than $2 billion.
Even more startling, by that same year (FY28) three of the approaches – “Stedman $1,300 PFD,” “POMV 25/75” and “Fields $1,000 PFD” – are running deficits larger than the projected statutory PFD (the column shaded in red in the chart or the dark blue line in the graphic). In those situations, even eliminating the PFD and diverting all of the revenue to government doesn’t balance the budget.
The instances where that occurs are shaded in yellow in the chart (or are above the dark blue line in the graphic).
In short, if the PFD continues to be used to fill the gap, it is gone by FY28 under three of the approaches, by FY 30 under a fourth (the “FY23 approach”), and not long after FY32 under most of the remainder.
Some naively suggest a “spending cap” is sufficient to avoid that result, but it’s not.
Because of declining revenues – driven by falling oil prices – the PFD is continually drained if it continues to be used to fill the gap even if the rate of spending growth is moderated by a cap. The point at which the PFD is exhausted may be pushed out a bit longer, but without substitute revenues, the writing is on the wall. Regardless of how it is calculated, a “spending cap” alone does not even remotely solve the problem; rather, as we explained in a previous column, “it’s a trap” for the PFD.
An even more important question is, as long as PFD cuts are used to fill in the gap, what is the net result of increasing spending on Alaska families?
While unwelcome to some, the answer is clear.
As government services expand – or at least keep pace with inflation – the economic position of middle and lower-income – 80% of – Alaska families grows disproportionately worse. As we have explained repeatedly from the very outset of these columns, by using PFD cuts to fund government deficits, most of the resulting financial burden is being pushed down to those families, taking money out of their pockets disproportionately to those in the top 20% (who contribute only a trivial share of their income to the costs of state government) and even more disproportionately compared to non-residents receiving income from sources in the state (who contribute nothing toward the costs of state government).
From the perspective of middle and lower-income Alaska families, funding the continued availability of government services at inflation-adjusted levels comes at a significant cost, taking far more as a share of income from their pockets than from the top 20% and non-residents, and taking far more as a share of income from their pockets compared even to what those same families would pay if the costs were recovered instead through broad-based taxes.
While some in government believe they may be winning the battle, it’s at the expense of middle and lower-income (again, 80% of) Alaska families – and through them, the overall Alaska economy – losing the war.
The fact that it’s Representatives Dan Ortiz (I – Ketchikan), the current proponent of POMV 25/75, and Zack Fields, the author of the “$1,000 PFD” approach, both of whom claim to be advocates of middle and lower-income Alaska families, helping to push the dagger even deeper makes the result even more ironic – and tragic.