


The Friday Alaska Landmine column: A couple of updates
Recent data updates - one on spending and deficit levels and the second on Permanent Fund returns - only deepen our concerns related to Alaska's fiscal situation

This week, we are updating the charts in our two previous columns – last week’s on the budget (“This is brutal”) and the one the week before on the performance of the Permanent Fund (“The real Permanent Fund reform that’s needed”) – to reflect more recent data.
Budget Deficits. Last week’s charts built on a recent warning from the Legislative Finance Division (“LFD”) in its annual “Overview of the Governor’s Budget” (Overview) that the state faces “a substantial deficit in FY26 even with a 75/25 PFD [Permanent Fund Dividend] appropriation.”
The “75/25 PFD appropriation” reduces the amount appropriated for the PFD from its statutory (“current law”) level to 25% of the annual percent-of-market value (POMV) statutory draw from Permanent Fund earnings and diverts (taxes) the remainder to the “unrestricted general fund” (UGF). The approach is the non-statutory, ad hoc approach the Legislature has used to balance the budget over the last few years.
The impact of a 75/25 PFD appropriation itself on Alaskans is significant. In FY25, for example, using the “75/25” rather than the existing statutory approach diverted (taxed) roughly $1.43 billion from the PFD to UGF. The similar number for FY26 is $1.51 billion. At current recipient and administrative cost levels, those diversions (taxes) have reduced the PFD by $2,300 and the income of the average Alaska household by $6,150 annually.
As LFD’s Overview made clear, however, given the ongoing rise in spending and decline in traditional (primarily oil-related) revenues, the level of diversions or other means of balancing the budget is likely to rise even further.
According to LFD, in addition to the already significant diversion,“[t]o balance the [FY26] budget” just at FY25 service levels, the Legislature will “need to reduce spending, pass legislation to increase revenue, further reduce the PFD, or draw from savings” by an additional $197 million (or $800 per average Alaska household).
As we explained in our previous column, however, that number itself is just the tip of the iceberg. It doesn’t consider any additional spending increases this Legislature may approve for FY26 beyond those necessary to maintain FY25 service levels. Moreover, it’s just a one-year number; it doesn’t reflect the state’s ongoing deficits.
To reflect the full impact of the situation facing the state, in last week’s column, we included a series of charts built on the most recent forecasts of both baseline revenue and spending levels, plus an additional factor to account for the potential approval of additional spending above the baseline in FY26 and beyond. The baseline revenues were taken from the Department of Revenue’s Fall 2024 Revenue Sources Book, adjusted for the impact of current projected oil prices and the Permanent Fund Corporation’s (PFC) most recent forecast of annual POMV draws. The baseline spending levels were taken from LFD’s Overview.
The factor we included for additional spending was an estimate based on recent news articles of the projected costs of HB 69, the Alaska House Majority’s recently introduced proposal to increase the K-12 Base Student Allocation (BSA). We based the estimate on recent news articles because the Fiscal Note for HB69 – the official projection of its costs – had not been published when we wrote the column.
However, since the time of our column, LFD has published the HB 69 Fiscal Note, which reflects projected cost levels substantially greater than those assumed in our calculations. The chart below summarizes the differences. The Fiscal Note includes projections through FY31. We have extended the projections through FY35 using the same escalation factor for subsequent years, which the Fiscal Note uses for the increase between FY30 and FY31.

These differences are so significant that our charts should be updated to accurately reflect the full depths of the state’s fiscal situation.
The first chart we included in last week’s column calculated the size of the current law deficits the state faces over the next 10 years based on the baselines plus the additional spending projected for HB 69. We projected current law deficits of $2.08 billion for FY2026, $2.60 billion for FY30, and $2.92 billion for FY35.
Here is the revision, reflecting the updated projected costs included in the Fiscal Note for HB 69.

While the projected current law deficit for FY2026 is generally the same ($2.07 billion), the deficits for FY30 ($2.87 v $2.60 billion) and FY35 ($3.41 v $2.92 billion) are substantially higher.
The second chart, which calculates the portion of the POMV draw required to balance the budget, demonstrates the significance of those higher deficit levels. While little remained for the PFD, in our previous charts, the size of the POMV was largely sufficient to balance the budget if it was entirely used for that purpose.
That is no longer accurate. Here is the revision, reflecting the costs included in the Fiscal Note for HB 69.

Again, while the impact on the POMV draw for FY2026 is generally the same (90%), the percent of the POMV draw required to balance the budget for FY30 (107% v 101%) and FY35 (107% v 97%) are substantially higher. Including the portion required to cover HB 69, by FY28 – merely 3 years from now – additional revenues above and beyond even the full POMV draw will be required to balance the budget. And unlike in the previous charts, that situation will continue throughout the remainder of the period rather than being isolated to a couple of years.
The impact of those higher deficits also becomes clear when we examine the other criteria we evaluated in our third chart last week: the size of the current law deficits as a percentage of spending, as a percentage of Alaska AGI (adjusted gross income), and as a percentage of the non-governmental (i.e., private) sector portion of Alaska GDP (gross domestic product).
Here is the revision, reflecting the costs included in the Fiscal Note for HB 69.

As with the second chart, all of the percentages from FY27 forward are materially larger than in last week’s chart. Using the updated spending projections, the deficit as a percent of spending grows from a base of 37% in FY26, to 46% (v. 42%) in FY30, and 49% (v. 42%) by FY35. The percent of the deficit as a share of AGI grows from a base of 5.7% in FY26, to 7.1% (v. 6.5%) in FY30, and 7.5% (v. 6.4%) in FY35.
Finally, the deficit’s share of Private Sector Alaska GDP grows from 3.5% in FY26, to 4.4% (v. 4%) in FY30, and 4.6% (v. 3.9%) in FY35.
As we said last week, the numbers we discussed then demonstrate that Alaska is facing a “brutal” fiscal future. These revised numbers make clear that the situation is even worse if additional spending at the full level proposed in HB69 is added.
Permanent Fund Performance. In our column the week before last, we analyzed the performance of the Permanent Fund against various benchmarks, taking into account the “Management and Incentive Fees” incurred by the Permanent Fund Corporation (PFC) in the course of its “active management” of the Fund. The charts demonstrated that over the past two years, plus the rolling 12-month through the first quarter of FY26, the Fund has not earned enough compared to the PFC’s own “Passive Index Benchmark” to pay for the Management and Incentive Fees the PFC is incurring.
Indeed, the charts showed that the Fund has not earned enough compared to its own “Passive Index Benchmark” to cover the “Management and Incentive Fees” it has paid in five of the last nine years, including the Rolling 12 months ending the first quarter of FY25.
Put another way, at the level of the fees paid, “active management” has cost the fund money compared to the “Passive Index Benchmark.” The Fund would have netted more money by putting the Fund’s management on auto-pilot, depositing the money instead in the passive funds included in the Passive Index Benchmark.
The charts also demonstrated that, as a percentage of assets under management, the PFC currently spends roughly double what Norway’s industry bellwether Government Pension Fund—Global (GPFG) spends on management and performance fees.
Since that column, the PFC has published updates through the second quarter of FY25 on the level of the Management and Incentive Fees it is paying and the Fund’s performance against its various self-selected benchmarks.
Here’s an updated chart comparing the Fund’s performance to the Performance Index Benchmark using the PFC’s more recent numbers.
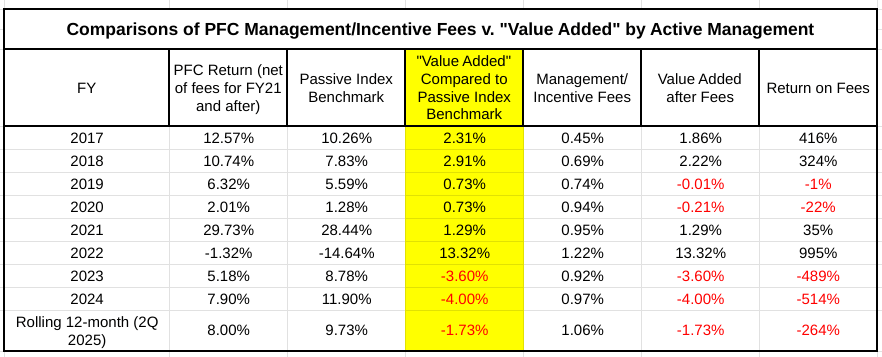
The updated information shows that while the Fund’s total return has improved over the most recent rolling 12-month period relative to its Passive Index Benchmark, it continues to lag after deducting the fees paid (minus 1.73% v. minus 12.5%).
Also, here is an update to the chart showing the amount of Management and Performance Fees paid by the Fund over the period compared to those paid by the Norwegian GPFG.

The update shows that the PFC spent even more on Management and Incentive Fees in the most recent period than in the previous period. The most recent report shows that the PFC spent approximately $860 million (or 1.06% of assets under management as of the end of the period) during the most recent period, compared to approximately $800 million (or 0.98% of assets under management) during the previous rolling 12-month period.
When measured as a percentage of assets under management, both are more than double the fees paid for managing Norway’s industry bellwether GPFG.
The updates reinforce the view we took in the prior column.
These charts emphatically demonstrate that the Permanent Fund’s problem is not, as the presenters at the Alaska Common Ground forum and others would have Alaskans believe, the Constitutional barrier to overdraws created by maintaining a separate earnings reserve.
The Permanent Fund’s problem is that it is not earning enough even to pay for the management and incentive fees the PFC is incurring, much less a return sufficient to cover the draws the Legislature wants to maintain.
The solution is not to eliminate the Fund’s overdraw protections, which are included in the Constitution, but to reform the PFC in ways designed to increase its returns.
In our prior column, we outlined the reforms that are needed for the PFC. We reaffirm them here.
Combined, these two updates demonstrate a significant part of the dilemma that Alaska is facing: spending is rising fast, while revenues are rising some, but not nearly at the same rate as spending. Most of the revenue lag is due to a significant drop in oil revenues, but the Permanent Fund is not immune from problems of its own.
While revenues from the Permanent Fund are rising some, even they are not keeping up with the growth in the deficits. Part of the reason for that appears to be the high level of Management and Incentive Fees the Fund is paying, which is suppressing the Fund’s return even below the level of its Passive Index Benchmark. Another part is, as demonstrated by our previous comparison of Permanent Fund returns against more public benchmarks, that the Fund is not keeping pace with the overall market.