The Friday Alaska Landmine column: What we likely will see in the Fall Revenue Forecast and 10-year plan and the issues they will create
We look at the fiscal outlook likely to emerge from the Fall Revenue Forecast and 10-year plan, and the issues that will create in the coming session for the Legislature
Since mid-November, we have been thinking about what the Dunleavy administration’s Fall Revenue Forecast and 10-year budget plan will likely look like when published sometime in the next two weeks.
Essentially, at a high level, there are two components involved in preparing the revenue forecast. The first is the level of anticipated traditional revenues. Those are largely driven by oil prices and volumes projected over the period. Over the past few years, the Department of Revenue (DOR) has based the oil prices on those prevailing in the futures market around the time the forecast is prepared. The Division of Oil & Gas generally has provided the volumes based on discussions with producers and the Division’s internal assessments.
The second component is the level of the percent of market value (POMV) draw made from the Permanent Fund earnings reserve pursuant to AS 37.13.140 and .145. That is periodically projected by the Permanent Fund Corporation (PFC) as part of its monthly “History and Projections” chart.
Preparing the 10-year budget plan involves adding a third component – projected spending levels. As we do in our weekly Friday charts, when thinking about those, we typically take the most recent unrestricted general fund (UGF) appropriations level passed by the Legislature and signed by the Governor and adjust it over the period by 2.5% annually, an approximation of the rate of inflation.
Typically, our projections of both traditional and POMV revenue levels are close to those included in the DOR revenue forecast. However, our projected spending levels usually are different from those included in the administration’s 10-year budget plan. The administration usually uses a lower growth rate than the rate of inflation to limit the size of the deficits it shows. As it did in last year’s 10-year plan, it also periodically claims that “When revenues fall, administrations and legislatures make the challenging, but necessary, policy decisions to prudently curtail State spending and carefully withdraw from savings when necessary.”
Over the years, however, we have come to realize that projections based on adjusting prior spending levels for inflation usually are closer to those made by the Legislative Finance Division (LFD) and, ultimately, the spending levels adopted by the Legislature and signed by the governor than those projected by the administration in its 10-year plan.
Based on the drop in oil prices over the last several weeks, we anticipate the biggest difference in the outlook for FY 2025 and subsequent years in the coming Forecast compared to last Spring’s look will be the level of traditional revenues. Here is our most recent comparison at the time we are finishing this week’s column of the level of traditional revenues as projected in the Fall 2023, Spring 2024, and as we anticipate will be projected in the coming Fall 2024 Revenue Forecasts:
The revenue levels are reflected in the bars, which are measured against the right axis. The budget for FY 2025 passed earlier this year and signed by Governor Mike Dunleavy (R – Alaska) was based on projected traditional revenue levels of $2.79 billion. As reflected on the chart, based on oil prices experienced to date and currently projected in the oil futures market for the remainder of the fiscal year, currently projected traditional revenue levels for FY 2025 now are only $2.54 billion, approximately $250 million less.
Traditional revenue levels for FY 2026 projected in the Spring 2024 Revenue Forecast were $2.64 billion. As reflected on the chart, based on current projected levels in the oil futures market, currently projected traditional revenue levels for FY 2026 are now only $2.47 billion, approximately $170 million less.
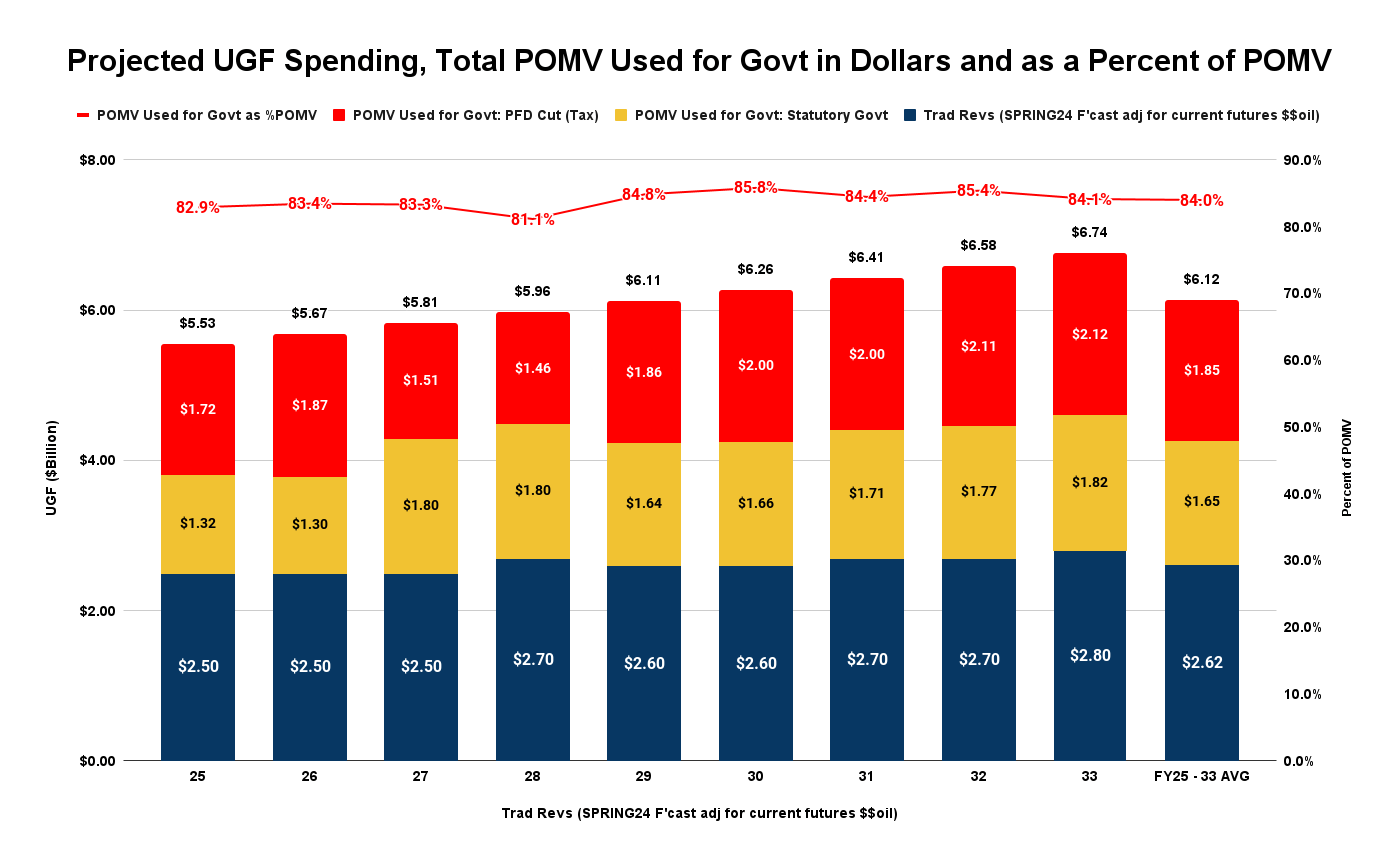
To provide a complete picture, the following chart adds to the projected traditional revenue levels, the POMV levels taken from the PFC’s latest projections, and the projected spending levels derived by starting with the FY 2025 appropriation level and adjusting it going forward annually by 2.5%.
Because of the drop in traditional revenues, the results are significantly different than those anticipated when finalizing the FY 2025 budget last spring.
One way of looking at the impact of the difference is, in the absence of replacement revenues, by calculating the percent of the POMV draw required to close the gap between traditional revenue and spending levels. Using last Spring’s numbers, the FY 2025 gap was closed using 74.9% of the POMV draw. The percentages went up from there. Closing the projected FY 2026 gap required using 79.9% of revenues, and the average over the full 10-year period was 81.7%.
Due to declining traditional revenues, current numbers are materially higher. Looking at the red line in the chart above, the FY 2025 number is now 81.8%, the FY 2026 number is 84.2%, and the average over the full 10-year period is 84.8%.
Readers should keep in mind that those numbers reflect only a 2.5% increase in spending over FY 2025 appropriated levels. During the recent legislative campaigns, candidates committed to increasing spending in several areas. While those increases could potentially be offset by reductions elsewhere in the budget to keep the overall increase within the rate of inflation, it is more likely that they will be layered on top instead.
If, for example, FY 2026 spending increases by 5% over FY 2025 levels, closing the gap without replacement revenues will require using 88% of the POMV draw in FY 2026 alone.
Such levels will likely present an uncomfortable challenge for the Legislature. In the last legislature, for example, the Senate majority coalition, in particular, made a major point of adopting as its fiscal policy a split in the POMV draw of 75% to support government spending and 25% to be distributed as a Permanent Fund Dividend (PFD). While the FY 2025 budget was within those boundaries at the time it was passed based on the then-current oil prices, it no longer is. Instead, based on current oil price projections, the FY 2025 budget requires 83% of the POMV draw to “balance.”
At currently projected traditional revenues and absent replacement revenue sources, the FY 2026 budget will require more than that, even if spending levels remain even with FY 2025. If spending rises from FY 2025 levels by inflation, and certainly if it rises from FY 2025 levels by more than inflation to accommodate new spending, the portion of the POMV draw used for government will far exceed the 75% level.
The numbers also present another challenge. In various statements since its formation, the new House majority coalition has emphasized that one of its goals is to achieve a “balanced” budget. By that they seem to mean simply that revenues will equal spending. But that’s not a particularly remarkable objective. To our knowledge, Alaska always has adopted a budget that is balanced in that sense.
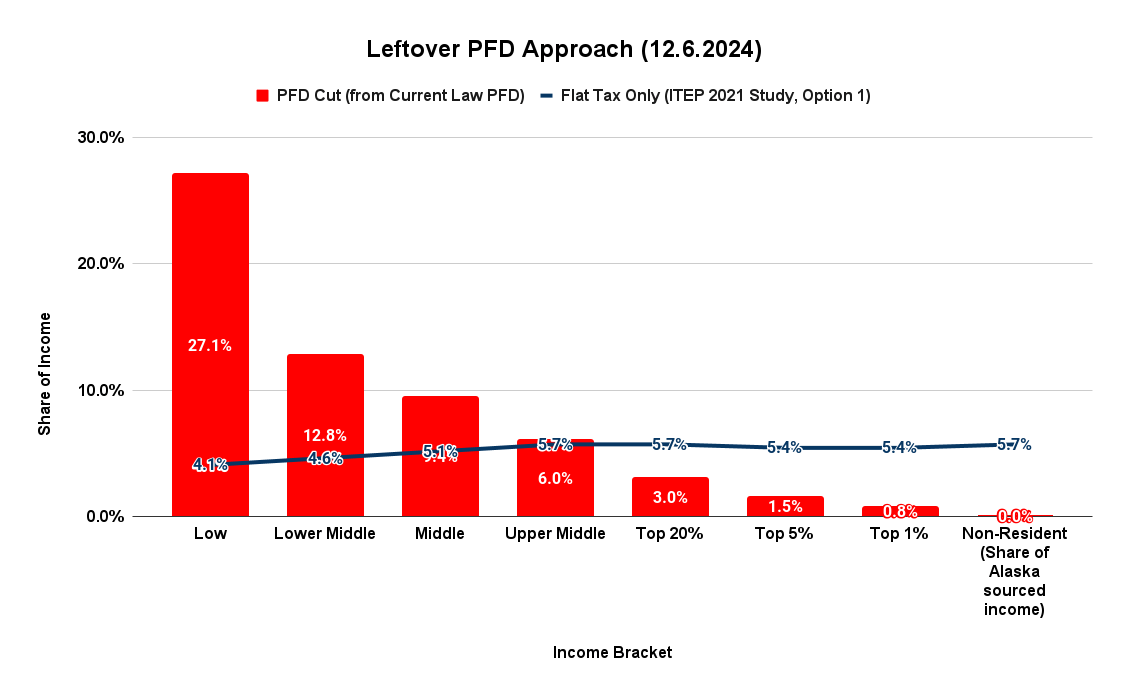
Unless they enact replacement revenues, however, their budgets certainly won’t be balanced from the perspective of Alaska families. Along with looking at the overall balance, each Friday we also publish charts that look at the impact by income bracket of using various approaches to match revenues with spending. Here is the most recent chart, which looks at the impact of using only the POMV to close the FY 2025 budget. Because of the size of the gap, that approach necessarily also requires significant reductions in the PFD levels provided under current law.
Compared to income at current law PFD levels, using only the POMV draw to bridge the gap between traditional revenues and spending results in reducing (taxing) the income of those in the lowest income bracket by 27%, those in the middle-income brackets on average by 9.4%, those in the top 20% by 3% and non-residents zero.
That is far from a “balanced” result. Instead, as Professor Matthew Berman of the University of Alaska – Anchorage’s Institute of Social and Economic Research (ISER) wrote in an op-ed last year, it reflects the “most regressive [revenue approach] ever proposed.”
Those elected to the Legislature on platforms claiming to prioritize “working Alaska families” will be challenged to harmonize that position with supporting a fiscal approach that not only takes more from 80% of Alaska families than would the flat tax included in the chart above or the ultra-broad sales tax we have discussed in previous columns but now also is projected to significantly breach the “25/75” partition some have previously claimed as their line in the state’s fiscal sand.
In short, the significant change in oil prices, and with that, overall revenues, has undermined the fiscal base many assumed when running for election. They will face significant challenges in reconciling the positions they took there with the reality they will face when arriving in Juneau next month.


